Just a heads up for those who read our blogs a lot. This blog is more technical than you might be used to. We wanted to make this overview as complete and comprehensive as possible!
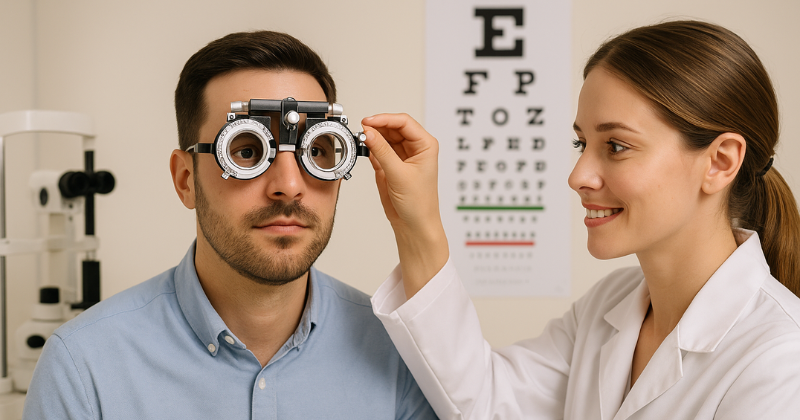
Visual assessment scales – like the familiar eye chart with its big letter E – are essential tools in clinical eye care. If you or a loved one has a visual impairment, you’ve likely heard terms like “20/20 vision” or “LogMAR” during eye appointments. But what do these terms actually mean? In simple words, they describe how clearly a person can see. Understanding these scales can help demystify eye exam results and foster better communication with your eye care professional.
Vision health is a big deal worldwide. The World Health Organization (WHO) reported in 2021 that “at least 2.2 billion people have a near or distance vision impairment” globally. This means billions of individuals and families receive eye exams and visual acuity tests each year. By learning about visual acuity scales, like the classic Snellen chart or the more precise LogMAR scale, you’ll be better equipped to understand eye test results and support the visually impaired in your life. Let’s explore these vision tests, how they work, and how different countries use them.
What Is Visual Acuity? (Understanding 20/20 Vision)
Visual acuity refers to the clarity or sharpness of vision – essentially, how well you can see details at a set distance. The most common measurement of visual acuity is done using a standardized chart viewed from a specific distance (often 20 feet or 6 meters). When eye doctors say someone has “20/20 vision,” they mean that person can see at 20 feet what a person with normal vision should see at 20 feet. In other words, 20/20 is considered normal visual acuity – not “perfect” vision, but average for healthy eyes.
The term 20/20 vision is actually a fraction comparing your vision to normal vision. The top number (20) is the testing distance in feet. The bottom number indicates the distance at which a person with normal eyesight could read the same line on the eye chart. For example, if you have 20/60 vision, it means you must be at 20 feet to read something a person with normal 20/20 sight can read from 60 feet. A leading ophthalmology group, the American Optometric Association, defines 20/20 as “normal visual acuity (the clarity or sharpness of vision) measured at a distance of 20 feet.” People with 20/20 can see the level of detail that should normally be seen from that distance. Meanwhile, someone with 20/100 vision needs to be much closer (20 ft) to see what a normal observer sees from 100 ft away.
It’s important to note that 20/20 doesn’t equal “perfect” vision. This ratio only measures clarity at a distance. Other aspects of eyesight, like peripheral (side) vision, depth perception, color vision, and focusing ability, are not captured by a visual acuity fraction. This means a person could have 20/20 visual acuity yet still struggle with other vision issues (for instance, difficulty focusing up close or color blindness). Eye doctors often say that 20/20 is just one piece of the puzzle for healthy vision.

So, when your friend proudly says they have 20/20 vision, you now know it means their distance vision is “normal sharpness.” And if someone’s vision is worse than 20/20 (say 20/40 or 20/100), the eye exam results help determine if glasses, contacts, or other treatments are needed to improve their clarity of sight. On the flip side, humans can sometimes have better than 20/20 (like 20/15). But generally, 20/10 is about the upper limit of natural human vision. For reference, in the US, a person with 20/200 vision (best corrected) is considered legally blind, since they see at 20 feet what a standard eye can see at 200 feet.
The Snellen Chart: The Classic Eye Test
The Snellen eye chart is a familiar sight in clinics – with the big “E” on top – used to measure visual acuity. When you think of an eye exam, you probably picture the Snellen chart, a poster of letters in decreasing size. This chart, introduced by Dutch eye doctor Herman Snellen in 1862, has become the worldwide standard for basic vision testing. During an exam, you stand 20 feet (or 6 meters) from the chart (often mirrored in smaller rooms to simulate that distance) and read down the lines of letters. Each row of the Snellen chart corresponds to a specific level of vision (20/40, 20/30, 20/20, etc.), and the smallest line you can read determines your visual acuity score.
On a Snellen chart, the top row usually has one large letter (often “E”). As you go down, the letters get smaller. The markings to the side tell you what normal vision is for that line. For instance, a line might be labeled 20/40 – meaning a person with standard 20/20 vision could read that line from 40 feet away. If 20/40 is the smallest line you can read, it implies your distance vision is not as sharp (you see at 20 ft what a normal eye sees at 40 ft). If you make it to the 20/20 line, congrats, you have normal acuity in that eye. Some charts even have extra rows for 20/15 or 20/10 to test better-than-average vision.
Global differences: Some countries use meters instead of feet for this test. In the UK and many other places, the same chart might be read at 6 meters, and 6/6 is equivalent to 20/20. Similarly, a 6/12 result in metric terms is comparable to 20/40 in the US system. Others use a decimal scale: for example, 1.0 represents 20/20, 0.5 represents 20/40, and so on. All these notations are just different ways to express the same results. To illustrate: a visual acuity of 6/36 (metric) is the same as 20/120 (US), which can also be noted as 0.16 (decimal) or LogMAR +0.78 – all indicating a moderate level of impairment. Eye care professionals can convert between these formats, ensuring your prescription or diagnosis is understood everywhere.
The Snellen chart is simple and effective, but it does have limitations. The lines have different numbers of letters, and the spacing between lines isn’t uniform, which can make some lines a bit easier or harder to read. Despite that, Snellen’s creation has stood the test of time. For over 150 years it’s been the go-to vision test – a quick way for optometrists and ophthalmologists to screen eyesight and decide if you need corrective lenses or further examination.
Beyond 20/20: Modern Scales (LogMAR and More)
While the Snellen chart is still widely used, eye care professionals have developed more precise tools to measure visual acuity. The most prominent is the LogMAR chart, which stands for “logarithm of the minimum angle of resolution.” That’s a mouthful, but in practice a LogMAR chart looks like a regular letter chart, just with a few clever improvements. Developed in 1976 by vision scientists Ian Bailey and Jan Lovie, the LogMAR (often called the Bailey-Lovie chart or ETDRS chart in research settings) was designed to address Snellen chart shortcomings.
What makes LogMAR charts different? First, each line has the same number of letters, typically five, and the letters are spaced evenly in proportion to their size. This creates a standardized testing experience. On a LogMAR chart, every letter you read (or miss) counts toward your final score in a consistent way. In fact, instead of a fraction like 20/20, LogMAR yields a number where 0.0 corresponds to 20/20, positive values indicate worse vision, and negative values indicate better than 20/20. For instance, LogMAR 0.3 is roughly equal to 20/40 vision, and LogMAR 1.0 corresponds to 20/200 (big letters only). Most healthy eyes land around 0.0 LogMAR. A few exceptional cases might hit -0.1 (slightly better than 20/20).
Eye doctors and researchers often prefer LogMAR or similar modern visual acuity scales when they need high accuracy, for example, in clinical trials or to track subtle vision changes. The ETDRS chart (developed for a large diabetic retinopathy study) is a type of LogMAR chart used at 4 meters and has become a gold standard in research. If you’ve ever been in a research study or a specialist’s office and the chart seemed a bit different (maybe no big “E” at top, and every row equally spaced), you likely encountered a LogMAR chart. Studies show LogMAR charts can provide more reliable results, especially when monitoring diseases or the effect of treatments.
Other specialized acuity tests include tumbling E charts (where patients indicate the direction of a letter “E”, useful for those who can’t read the alphabet) and Landolt C rings (circles with a gap, where one identifies the gap’s position). These aren’t separate scales but alternative optotypes (symbols) for measuring acuity, often used for children or illiterate individuals. No matter the symbols used, the goal is the same: determining the smallest detail the eye can resolve.
In summary, modern charts like LogMAR provide a more nuanced visual acuity scale. They complement the Snellen chart by offering consistency and allowing vision to be recorded as a numeric score that’s very useful for tracking changes over time. For everyday eye exams, Snellen works well; but for research and serious clinical monitoring, LogMAR is the star player.
Functional Vision Tests: More Than Just an Eye Chart
Visual acuity (those 20/20 numbers) is crucial, but it’s not the whole story of someone’s vision. Two people with the same 20/60 acuity might function very differently in daily life. This is where functional vision tests come in. They assess how well a person uses their vision for everyday tasks. Eye care professionals use these tests to paint a fuller picture of visual ability, beyond just the clarity of letters on a chart.
Here are a few key functional vision assessments used in clinics:
-
Visual Field Tests: These check peripheral vision – how wide an area you can see when looking straight ahead. For example, a common method is a bowl-like device where small lights flash and you press a button when you see them in your side vision. This helps detect conditions like glaucoma that affect peripheral sight.
-
Contrast Sensitivity: This test measures the ability to distinguish faint contrasts, not just black-on-white like a Snellen chart. A contrast sensitivity chart might show gray letters on a white background. It’s important for night driving or seeing in low contrast situations. Someone might have 20/20 acuity yet poor contrast sensitivity, making it hard to, say, spot a light gray object on a beige background.
-
Color Vision Testing: Often done with those dot pattern books (Ishihara plates) full of colored dots forming numbers. This evaluates if a person can discern colors accurately or has a color deficiency.
-
Depth Perception and Binocular Vision: Tests like the stereo fly or special glasses can see if both eyes work together to gauge depth. This is important for tasks like catching a ball or driving.
-
Reading Speed and Near Vision: For individuals with low vision, doctors might have them read blocks of text aloud (with best correction) to see how print size and spacing affect their reading ability. There are also near-vision charts (like ones with paragraphs at different font sizes) that determine the smallest print you can comfortably read.
Why are these functional tests important? Because a person isn’t just a number on an eye chart. Real-world vision involves navigating space, recognizing faces, reading signs, and more. As one eye doctor put it, having 20/20 sight with poor peripheral vision is like seeing clearly through a tunnel – sharp but very limited. Likewise, someone might read the chart letters in a quiet exam room but struggle with moving objects or low contrast conditions. By doing functional tests, optometrists can uncover issues like trouble with glare, difficulties in dim lighting, or the need for visual aids in daily activities.

In practice, after your standard eye chart exam, the doctor might say, “Your acuity is 20/40, let’s see how your eyes function in other ways.” If a problem is detected (for instance, reduced side vision), interventions can be recommended – maybe orientation and mobility training for navigating safely, or special tints for glare. The bottom line is eye health is multi-faceted. Visual acuity tests how well you see detail at a distance, while functional vision tests how well you use your vision in real life.
Global Variations in Vision Standards
One fascinating aspect of visual assessment is how it’s recorded a bit differently around the world, even when the underlying vision is the same. If you’ve ever moved to another country or read an international prescription, you might notice unfamiliar numbers. Don’t worry, your eyes haven’t changed; just the notation has.
-
Feet vs. Meters: The United States and a few others use feet in the Snellen system (20/20). Many countries use meters, resulting in the well-known 6/6 notation. It’s essentially the same scale with different units: 6/6 equals 20/20, 6/12 equals 20/40, 6/60 equals 20/200, and so on. The switch is straightforward: 1 foot is ~0.3 meters, so you multiply or divide accordingly. British eye clinics, for example, often record vision as 6/5, 6/6, 6/12, etc. instead of fractions with 20.
-
Decimal Visual Acuity: In parts of Europe and Asia, you’ll encounter a decimal system for acuity. Here, 1.0 is normal vision (20/20), and values less than 1.0 indicate worse vision. Every 0.1 step roughly corresponds to one line on the chart. So 0.8 is about 20/25, 0.5 is 20/40, 0.1 is 20/200, and so forth. Decimal charts are convenient – a higher number always means better vision, but they convey the same info as Snellen fractions. For instance, in Japan or Germany a doctor might write “0.7” instead of “20/30” or “6/9”.
-
“Counting Fingers” and More: In any country, when vision is too poor to read even the top line of the chart (20/400 or 6/120, typically), clinicians use functional descriptions. You might see notes like CF (Counting Fingers) at a certain distance, HM (Hand Motion), or LP (Light Perception). These are universal indicators of low vision levels. For example, “CF at 3m” means the person can count fingers from 3 meters but not make out any chart letters. Such terms are used worldwide for consistency when acuity falls outside the chart range.
-
LogMAR in Research: As mentioned, LogMAR is increasingly the standard in research and academia globally. So in international studies, you’ll often see vision recorded as LogMAR values (e.g., 0.3, 1.0, etc.) which can then be converted back to Snellen or decimal for practical use. An advantage here is that calculations (like averaging vision improvement) are more straightforward in LogMAR units.
Despite these different formats, eye care professionals are well-versed in converting between them. Your eyeglasses prescription or surgery eligibility won’t change just because one country writes 0.4 and another writes 20/50, they represent the same visual acuity. Still, it’s interesting for patients to know. If you’re traveling or moving, understanding that 6/6 = 20/20 = 1.0 can be reassuring. It’s all the same eyesight, spoken in different “languages” of vision.
In summary, whether an eye doctor says your vision is 0.8, 6/7.5, or 20/25, they’re likely describing nearly identical acuity. The global goal is uniform: assess vision accurately to guide care. So even if the numbers or units vary, rest assured that there’s an international equivalence for all these visual assessment scales. Eye care truly speaks a universal language when it comes to helping patients see their best!
Conclusion
Understanding visual assessment scales can turn an overwhelming eye exam report into meaningful information. Now you know that 20/20 vision is just a way to say “normal sight,” the Snellen chart is that classic tool to measure it, and scales like LogMAR provide a research-grade lens into acuity. We’ve also seen that seeing “20/200” or “0.1” on a report simply depends on where you are in the world, the eyes are tested the same way, just noted differently.
For friends and family of those with visual impairments, this knowledge is power. It helps you grasp the extent of a loved one’s vision loss and the purpose behind each test the eye doctor performs. When the doctor talks about contrast sensitivity or visual fields, you’ll recognize these as functional vision tests that measure real-world seeing, not just lines on a chart. And when you hear that someone’s vision is 20/80 (or 6/24, or 0.25 decimal), you’ll understand this means they see at distance with some blurriness, perhaps needing larger print or additional support.
Speaking of support, technology is continually improving to assist people with low vision. Specialized gadgets and apps can make a world of difference. For instance, Hable offers an affordable assistive technology (see iamhable.com), empowering visually impaired users to perform everyday tasks. Tools like these, combined with regular eye exams and proper use of visual assessment scales, ensure that vision loss can be managed and mitigated as much as possible.
In the end, an eye chart is a snapshot of someone’s interaction with the world. By staying informed about vision tests and scales, you can better advocate for eye health, celebrate improvements (like a new pair of glasses bringing someone from 20/100 to 20/30), and access resources that enhance quality of life for those with limited sight. With clear information, we can all see a bit more clearly when it comes to understanding vision.
FAQ
1. What is a visual assessment scale and why is it important?
A visual assessment scale is a standardized method used by eye care professionals to measure how clearly someone can see. These scales, like the Snellen chart or LogMAR chart, help detect vision problems, diagnose eye conditions, and monitor changes in eyesight. They're essential for creating accurate prescriptions and ensuring proper treatment or vision support tools are provided.
2. What is the difference between Snellen and LogMAR charts?
The Snellen chart uses different-sized letters to measure distance vision in a simple fraction (like 20/20), while the LogMAR chart provides a more precise, scientific score using a logarithmic scale. LogMAR is preferred in clinical studies and for tracking subtle vision changes over time. Both measure visual acuity but use different methods and scoring systems.
3. What does 20/20 vision really mean?
20/20 vision means you can see at 20 feet what a person with normal vision should see at 20 feet. It’s considered "normal" distance vision. If you have 20/60 vision, for example, it means you need to be 20 feet away to see what someone with normal vision can see from 60 feet away.
4. How do visual acuity measurements differ around the world?
Visual acuity can be expressed in several ways:
-
20/20 (feet-based) – commonly used in the US
-
6/6 (meter-based) – used in the UK and many other countries
-
Decimal (e.g., 1.0) – used in Europe and Japan
-
LogMAR (e.g., 0.0) – common in research
These scales all measure the same thing, just in different formats.
5. What should I do if a loved one fails a vision test or has low visual acuity?
If someone close to you is diagnosed with low visual acuity, the first step is to follow up with a certified eye care professional. Usually, an optometrist or ophthalmologist. They can determine whether the vision loss is correctable (with glasses or contacts) or related to an underlying eye condition. Early detection is key. You should also explore vision rehabilitation services, which offer training, assistive devices, and lifestyle adjustments to help individuals maintain independence and quality of life.